Methods
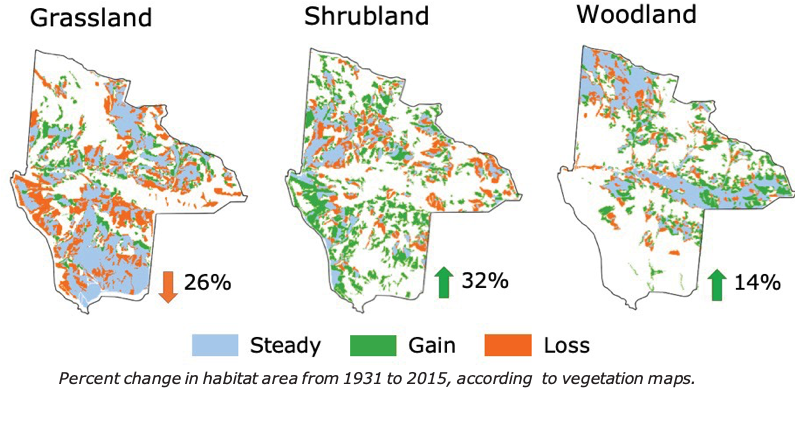
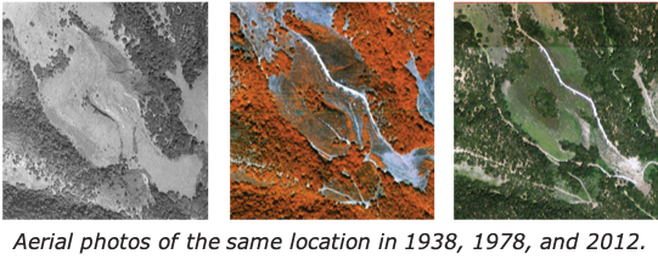
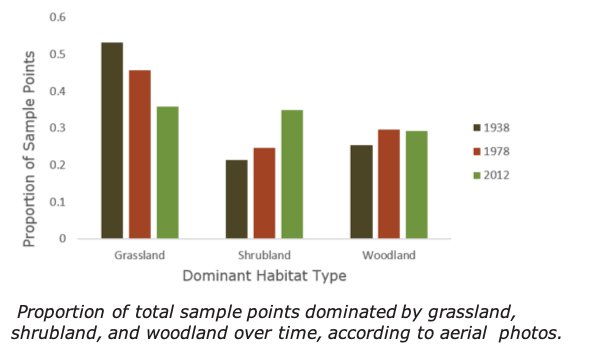
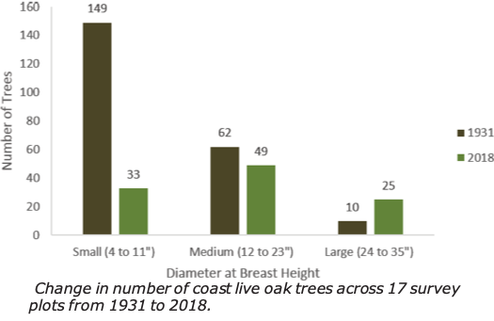
We used aerial photographs to identify the frequency of habitat types at 340 random sample points in 1938, 1978, and 2012. We used vegetation maps to calculate percent change in area of habitat types from 1931 to 2015. We repeated historical coast live oak field surveys from 1931. At survey plots, we counted the number of trees and measured their diameter at breast height.
We used aerial photographs to identify the frequency of habitat types at 340 random sample points in 1938, 1978, and 2012. We used vegetation maps to calculate percent change in area of habitat types from 1931 to 2015. We repeated historical coast live oak field surveys from 1931. At survey plots, we counted the number of trees and measured their diameter at breast height.
Results
Photos and maps show grassland has decreased, while shrubland and woodland have increased. This trend may be driven by historic fire suppression on the property. Although woodland area has increased, there are fewer trees within this area — particularly, fewer small trees. This suggests the oak population is aging, with low establishment and survival of new young oaks. This trend may be driven by historic cattle grazing, deer and rodent herbivory, and/or competition with annual grasses for water.
Photos and maps show grassland has decreased, while shrubland and woodland have increased. This trend may be driven by historic fire suppression on the property. Although woodland area has increased, there are fewer trees within this area — particularly, fewer small trees. This suggests the oak population is aging, with low establishment and survival of new young oaks. This trend may be driven by historic cattle grazing, deer and rodent herbivory, and/or competition with annual grasses for water.
|
|